
How biological age and aging speed are computed.
The methodology rests on patterns within locomotor activity — not raw step counts, which are too noisy on their own. The patterns examined are intensity transitions, duration of sustained activity, recovery cadence between bouts, and perpetuity of activity over weeks. These have been shown in peer-reviewed work to correlate with biological age, mortality risk, and chronic-disease incidence.
From sensor to BioAge — five stages.
The journey from raw phone-sensor data to a personalised aging indicator is a deliberate sequence. Each stage is inspectable; nothing is opaque.
- Step 01
Sensor
Locomotor activity (steps, motion intensity) is read from the phone or from connected wearables.
- Step 02
Preprocess
Streams are normalised, calibrated across devices, and require a minimum window before any reading is produced.
- Step 03
Model
A peer-reviewed BAA model translates the activity patterns into a biological-age estimate.
- Step 04
Calibrate
A confidence rating is computed alongside. Less data, more variance, or signal gaps lower the confidence; users see both the number and how much weight to put on it.
- Step 05
Surface
BioAge, 28-day aging-speed trend, and confidence are surfaced together in the app. Never a daily figure.
What it doesn't claim.
Three boundaries that are part of the methodology, not addenda to it.
- Not a clinical diagnosis
BioAge is a wellness signal validated in peer-reviewed research, not a medical diagnostic. The model does not detect, treat, cure, or prevent disease, and is not a medical device.
- Not a recommendation engine
The methodology informs decisions; it does not make them. The product never tells the user (or the user's advisor) what to do. It shows how decisions reshape given the trajectory.
- Requires ≥10 days of data
No reading is produced before the minimum window is met. A short tail of activity is too noisy to interpret as biological age, and the product will not surface a premature number with false-precision. The first reading needs at least ten days of activity; the aging-speed trend is then computed over a rolling 28-day window.
Biological age
A 50-year-old can have a biological age of 45 (slower aging, in better physical condition than the average 50-year-old) or 56 (faster aging, accumulated wear and tear). Biological age is a slow-moving indicator: it changes over weeks and months in response to sustained patterns of activity, recovery, stress, and lifestyle.
Aging speed
Aging speed is how fast a person is aging relative to the calendar. It is built in two layers. The raw signal — biological age acceleration (BAA) — is an instantaneous reading: informative, but noisy day to day. We smooth that signal into a long-term trend, and it is the trend, not any single day, that the product reports as aging speed. Day-to-day fluctuation does not move it; sustained patterns of activity, recovery, and stress do.
The practical consequence: a person who begins exercising regularly, sleeping better, or managing stress will see aging speed bend first — it responds to the change in behaviour. Biological age, the slower integrated quantity, follows over the months that follow.
Alongside the speed, the product shows a simple, readable gap — how many years biological age currently runs ahead of or behind chronological age:
- 0biological age tracking chronological; the body is keeping pace with the calendar
- +4biological age four years ahead; the body has accumulated more wear than the calendar suggests
- −3biological age three years behind; typically the result of sustained positive lifestyle patterns
Why locomotor activity
Three properties make locomotor activity the right input class:
Modern smartphones record steps and movement continuously, with no additional hardware, sensors, or appointments required.
A blood test or DNA assessment is a snapshot. Locomotor data accumulates daily, automatically, capturing patterns of activity, intensity, recovery, and consistency. The indicator improves with the length of the record.
The underlying methodology has been validated in peer-reviewed work against external biomarkers — DNA-methylation clocks, blood-based markers, and other clinical inputs — showing agreement consistent with those established methods.
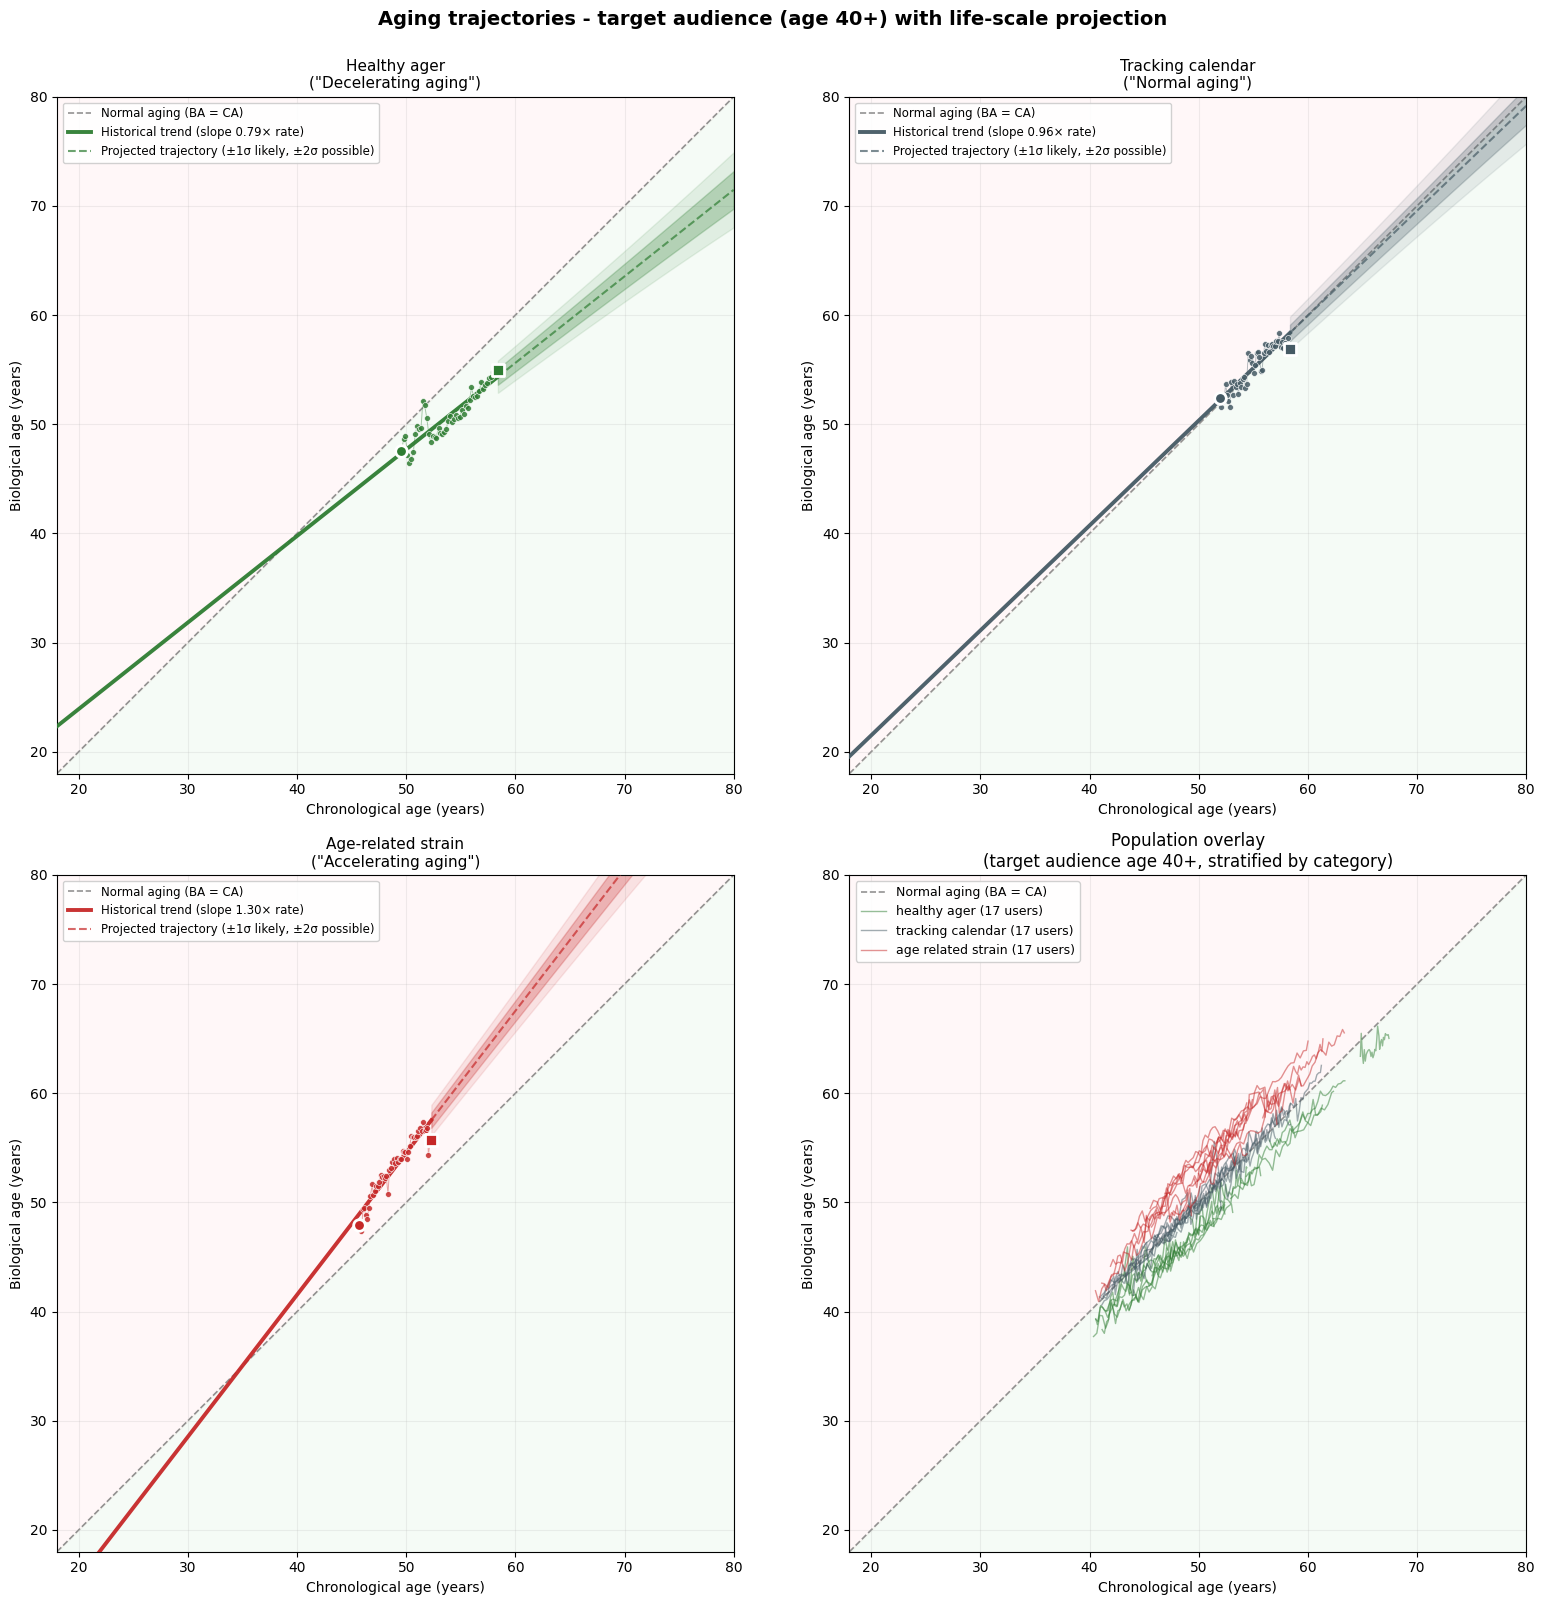
Aging trajectories — what the output looks like
Each user has a biological-age trajectory plotted against chronological age. The vertical distance from the diagonal is the current gap in years; the slope of the line is aging speed — whether that gap is widening, holding, or narrowing over time. Three categories emerge in the target audience (age 40+):
See the mechanics, without your data.
The tool below is educational, not the in-app product: it runs entirely on public U.S. Social Security Administration population mortality data, not on any measured biological age. It exists to make the boundaries above concrete — how a gap and a pace, held for longer or shorter, mechanically reshape a survival curve — before those same concepts are ever computed from a real activity record.
How ageing speed shapes your outlook
Explore how your biological age and rate of biological change could shift lifetime survival probability, based on U.S. Social Security Administration population mortality data. This is an educational illustration, not a personalised assessment.
How to read this. The band is the answer, not the line — the median is a 50%-likelihood point by construction. This tool shows a trajectory built from population statistics and a hypothetical bio-age input; it is a conversation starter for you and a financial professional, not a prediction of when any specific event will occur.
Data source. Mortality probabilities are the U.S. Social Security Administration's 2023 Period Life Table (as used in the 2026 Trustees Report), applied directly by exact age and sex — not a fitted curve.
About the healthy-years estimate. Figures marked illustrative use a simplified population-level heuristic (a fixed forward-age offset applied to the same mortality table) to approximate the transition to needing regular care. This is not a personalised or clinically validated health forecast.
The dial below is a different view of the same public data: for a current age, sex, and bio-age gap you choose, it shows conditional survival probability, remaining healthy years, and remaining life expectancy at a glance — the same source tables, read at a single point in time rather than as a trajectory.
How age, sex and BioAge gap shape the outlook
A clock-style view of survival probability, remaining healthy years, and remaining life expectancy, built from real U.S. population tables. This is a scenario you set, not a personalised measurement.
How to read this. You choose the bio-age gap — the dial does not measure how fast you personally age. It shows what that scenario implies for population-level survival, healthy years, and life expectancy, as a conversation starter for you and a financial professional, not a prediction.
Data source. Survival is the U.S. Social Security Administration's 2023 Period Life Table, applied directly by exact age and sex — the same table and the same calculation used by the trajectory tool above, so the two agree.
About the healthy-years figure. "HS" uses a simplified population-level heuristic — a fixed forward-age offset applied to the same mortality table — to approximate the transition to needing regular care. This is not a personalised or clinically validated health forecast.
Financial projection layer
The financial-projection model computes retirement projections from a small set of inputs the user provides — current savings, planned contributions, expected investment return, target retirement age, payout scheme — combined with publicly available actuarial statistics and information about retirement products.
The model is intentionally transparent. A user, advisor, or provider analyst can inspect each input, follow the calculation, and see how the output changes when an assumption changes. There is no opaque black box; there is no hidden parameter.
Current limits
The model is intentionally simple at present:
- ·Inflation is not yet modelled separately from the return assumption
- ·Contribution-growth profiles are not yet user-configurable
- ·Family and household plans are not yet supported
These are deliberate simplifications that keep the model accessible, easy to explain, and easy for non-specialist users to interrogate. The model is on a clear path of progressive sophistication, including through future integrations with retirement-product providers.
Read the publications.
Six peer-reviewed papers underwrite the methodology. Each entry on the publications page has a one-line takeaway.